
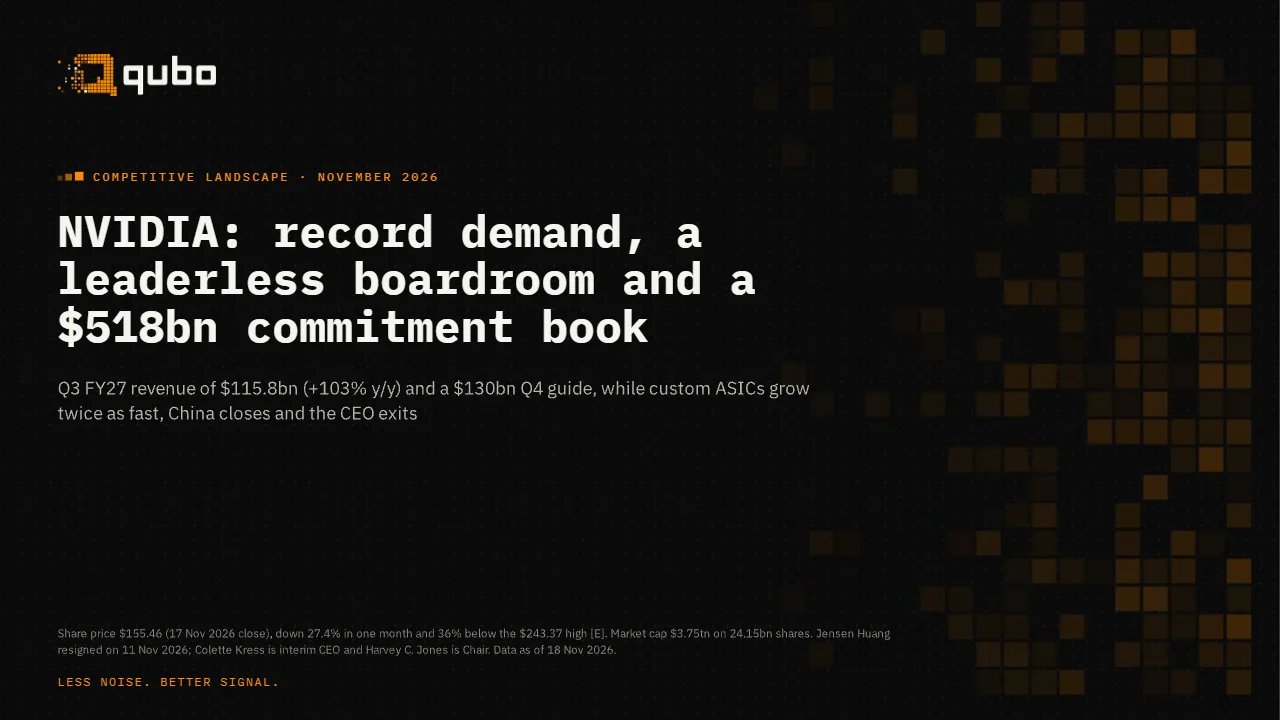
NVIDIA: record demand, a leaderless boardroom and a $518bn commitment book
This report covers NVIDIA: the business, its competitors, the numbers and the debates to watch. Read the full deck in the Qubo Terminal.
What the report says.
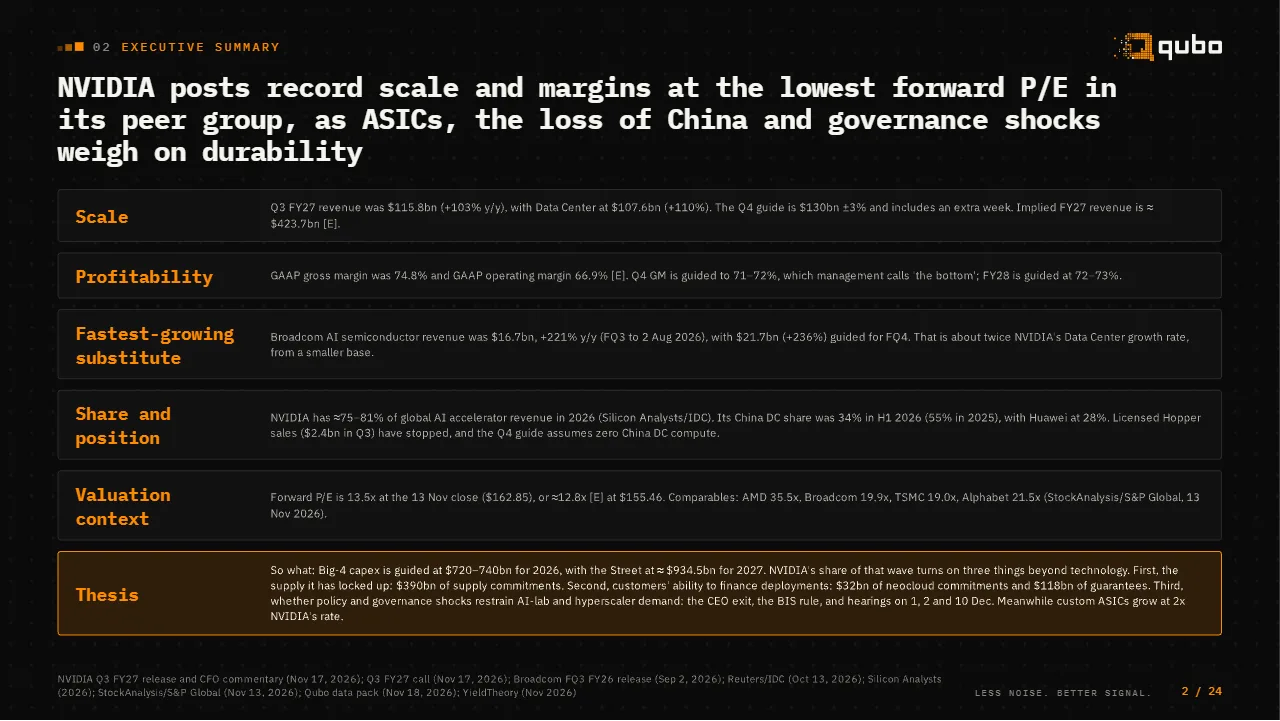
Scale
Q3 FY27 revenue was $115.8bn (+103% y/y), with Data Center at $107.6bn (+110%). The Q4 guide is $130bn ±3% and includes an extra week. Implied FY27 revenue is ≈ $423.7bn [E].
Profitability
GAAP gross margin was 74.8% and GAAP operating margin 66.9% [E]. Q4 GM is guided to 71–72%, which management calls 'the bottom'; FY28 is guided at 72–73%.
Fastest-growing substitute
Broadcom AI semiconductor revenue was $16.7bn, +221% y/y (FQ3 to 2 Aug 2026), with $21.7bn (+236%) guided for FQ4. That is about twice NVIDIA's Data Center growth rate, from a smaller base.
Share and position
NVIDIA has ≈75–81% of global AI accelerator revenue in 2026 (Silicon Analysts/IDC). Its China DC share was 34% in H1 2026 (55% in 2025), with Huawei at 28%. Licensed Hopper sales ($2.4bn in Q3) have stopped, and the Q4 guide assumes zero China DC compute.
// THE DEBATESo what: Big-4 capex is guided at $720–740bn for 2026, with the Street at ≈ $934.5bn for 2027. NVIDIA's share of that wave turns on three things beyond technology. First, the supply it has locked up: $390bn of supply commitments. Second, customers' ability to finance deployments: $32bn of neocloud commitments and $118bn of guarantees. Third, whether policy and governance shocks restrain AI-lab and hyperscaler demand: the CEO exit, the BIS rule, and hearings on 1, 2 and 10 Dec. Meanwhile custom ASICs grow at 2x NVIDIA's rate.
24 slides, 23 chapters.
CHAPTERACCESS
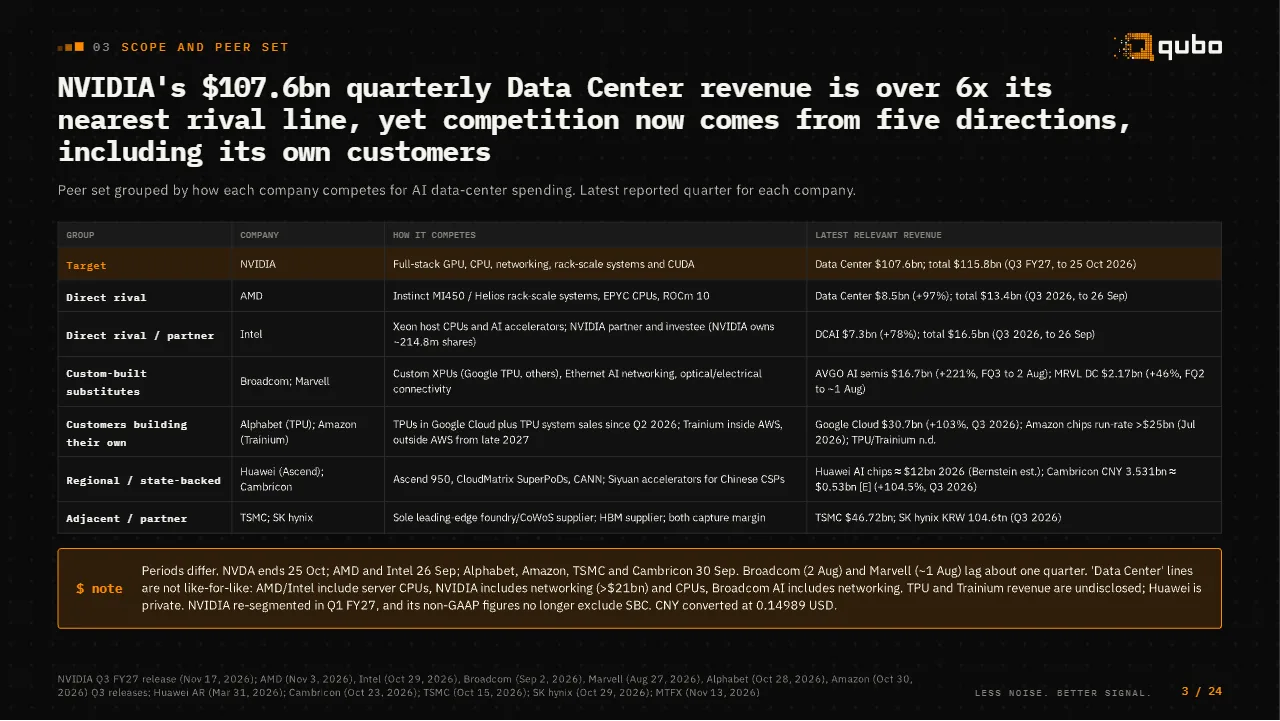
The first slides, as they appear in the reader.
No PDF to download or forward.
How to read it.
Starter
Not included
Qubo Research is for subscribers, from Pulse.
Pulse · Edge
1 or 5 reports a month
1 with Pulse, 5 with Edge, plus previews and flash notes.
Apex
Library included
Every report, every edition and the archives. 5 custom reports a month.
Editions:Nov 2026Follow the series in the Terminal to get the next one.
Read it next to the live NVDA chart.
Open the report in the Terminal: price, news and why it moves, on the same screen.
General research, the same for every reader: it does not take anyone’s situation into account and does not recommend buying, selling or holding any asset. No price targets. May contain errors.